 Francesco Chiaramonte
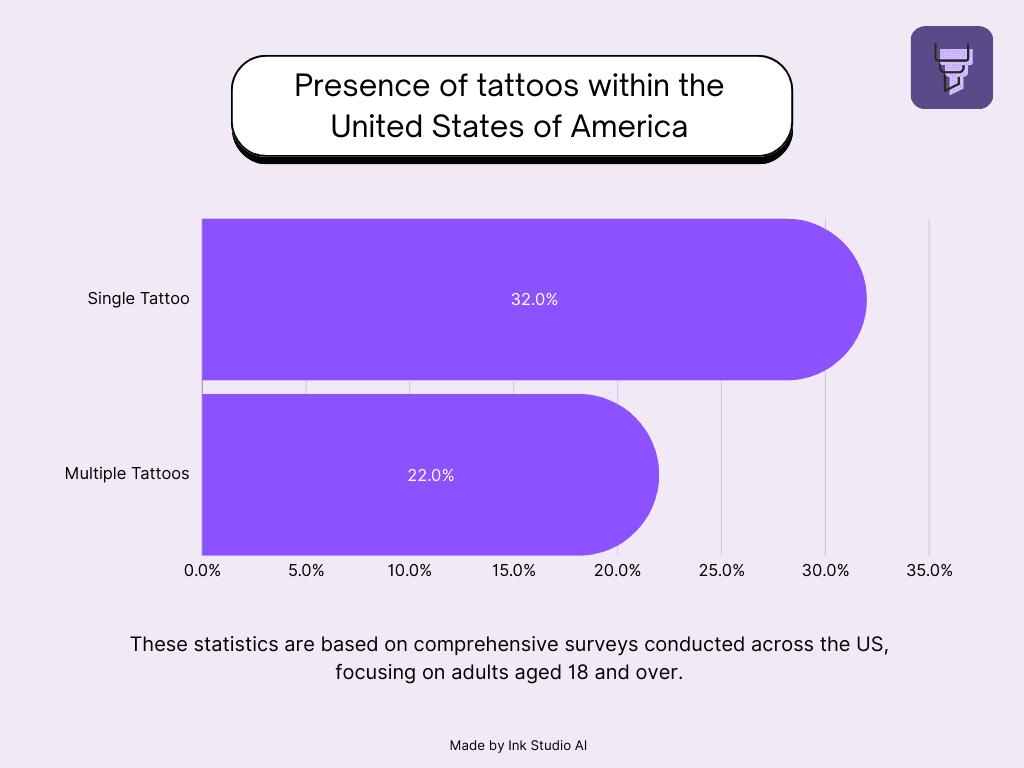
How many people have tattoos? In the United States, 32% of adults have at least one tattoo and 22% have more than one, according to Pew Research Center's 2023 survey of 8,480 adults. Pew has not published a newer figure as of October 2026. Nobody counts tattoos worldwide, so there is no single global number. National surveys put the share between about 12% and 48% depending on the country and the method.
 Tattoo Statistics Worldwide
I run a tattoo design tool, so I read these surveys often. Below I have collected the numbers that hold up, with the source and year next to each one. I also explain why two surveys about the same country can disagree by 30 points.
Tattoo Statistics at a Glance
| Statistic | Figure | Source and year |
|---|---|---|
| US adults with at least one tattoo | 32% | Pew Research Center, 2023 |
| US adults with more than one tattoo | 22% | Pew Research Center, 2023 |
| US women aged 18-29 with a tattoo | 56% | Pew Research Center, 2023 |
| Tattooed Americans who regret at least one | 24% | Pew Research Center, 2023 |
| Highest share in a multi-country online survey | Italy, 48% | Dalia Research via Statista, 2018 |
| People in the EU with a tattoo | About 12% (60 million+) | JRC report, cited by Italy's ISS, 2016 |
| Canadians with a tattoo | About one third | Narrative Research, 2024 |
Global Tattoo Trends: How Many People in the World Have Tattoos?
 Tattoo Statistics Top 3 Countries
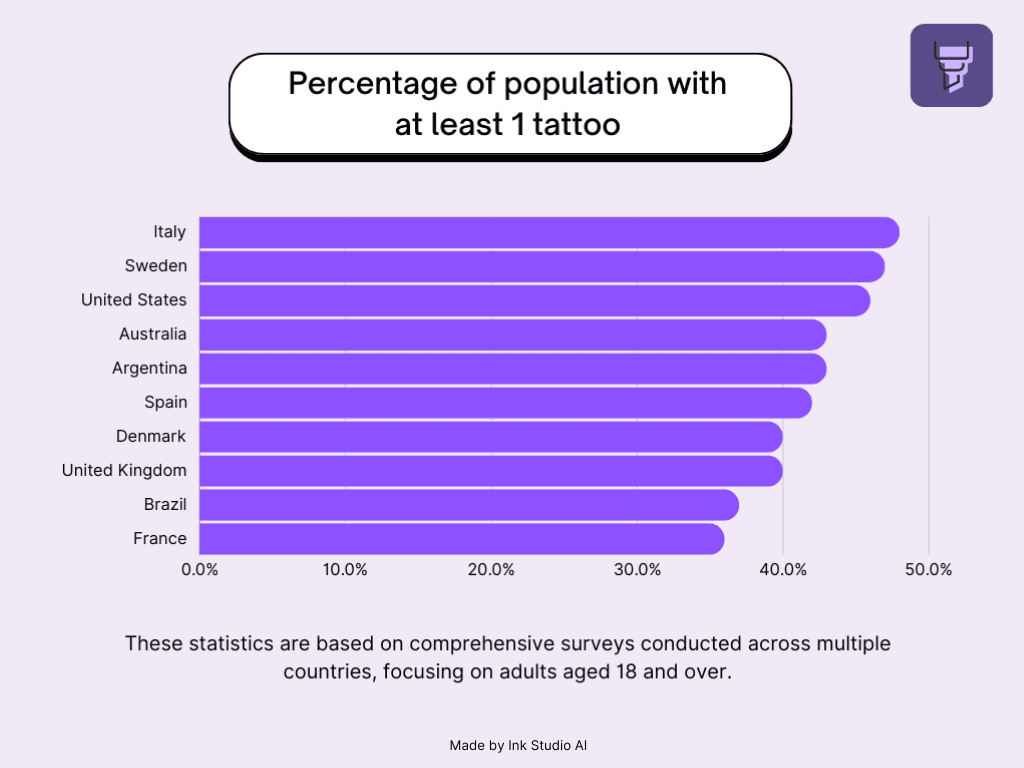
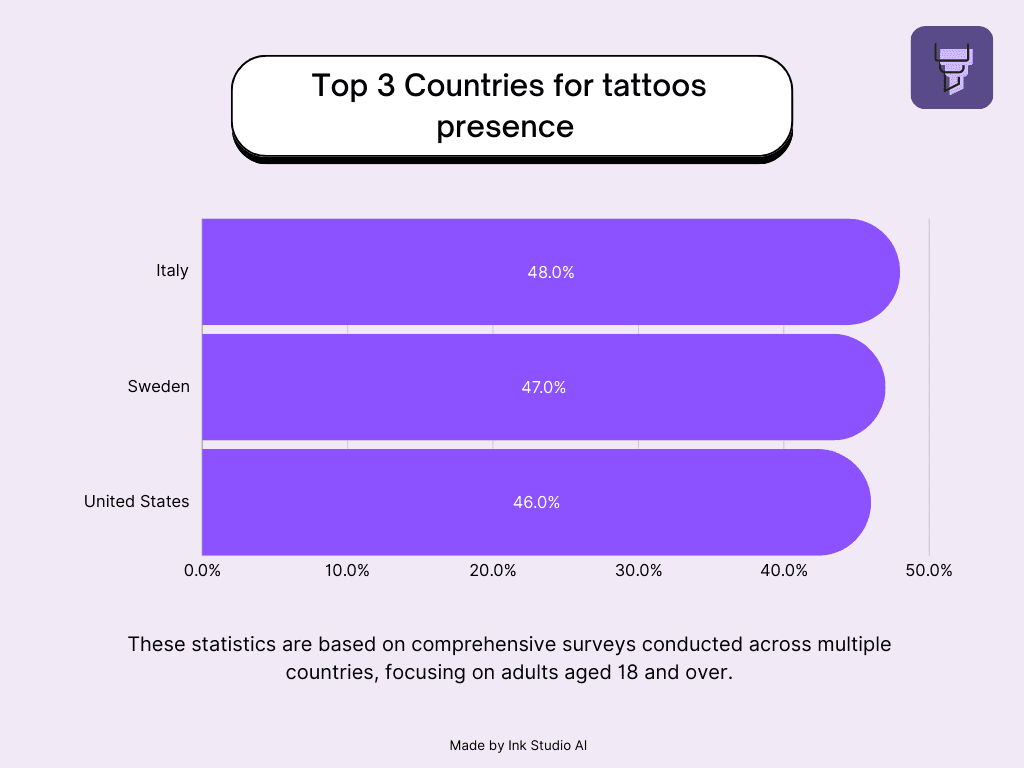
The most quoted country ranking comes from an online survey by Dalia Research in 2018. Statista's summary reports Italy highest at 48%, the United States at 46%, and Greece lowest at 35% of internet users surveyed. WorldAtlas (2024) lists the full top 10 from the same ranking.
| Rank | Country | Share with at least one tattoo |
|---|---|---|
| 1 | Italy | 48% |
| 2 | Sweden | 47% |
| 3 | United States | 46% |
| 4 | Australia | 43% |
| 4 | Argentina | 43% |
| 6 | Spain | 42% |
| 7 | Denmark | 41% |
| 8 | United Kingdom | 40% |
| 9 | Brazil | 37% |
| 10 | France | 36% |
These numbers describe people who answer online panels, not whole populations. Online panels lean younger and more urban, and those groups have more tattoos. National surveys with stricter sampling give much lower numbers for several of the same countries.
National Surveys by Country
| Country or region | Share with a tattoo | Method | Source and year |
|---|---|---|---|
| United States | 32% | Probability panel, 8,480 adults | Pew, 2023 |
| Canada | About one third | Online omnibus, 1,230 adults | Narrative Research, 2024 |
| United Kingdom | 26% | Online panel | YouGov, 2022 |
| Germany | 21% | Online panel, 2,042 adults | YouGov for dpa, 2022 |
| Italy | 12.8% | National health survey, 7,608 people (12+) | Istituto Superiore di Sanità, survey ended 2015 |
| European Union | About 12% | Estimate from EU survey data | JRC, 2016 |
Italy shows the gap clearly. The online survey says 48%, while the Italian National Institute of Health counted 12.8% (about 6.9 million people) in a representative sample that also included teenagers. The European Chemicals Agency estimates that about 62 million people in the EU had a tattoo in 2014, up from about 30 million in 2003, according to the ISS summary.
Canadian Perspective
 Tattoo Statistics in Canada
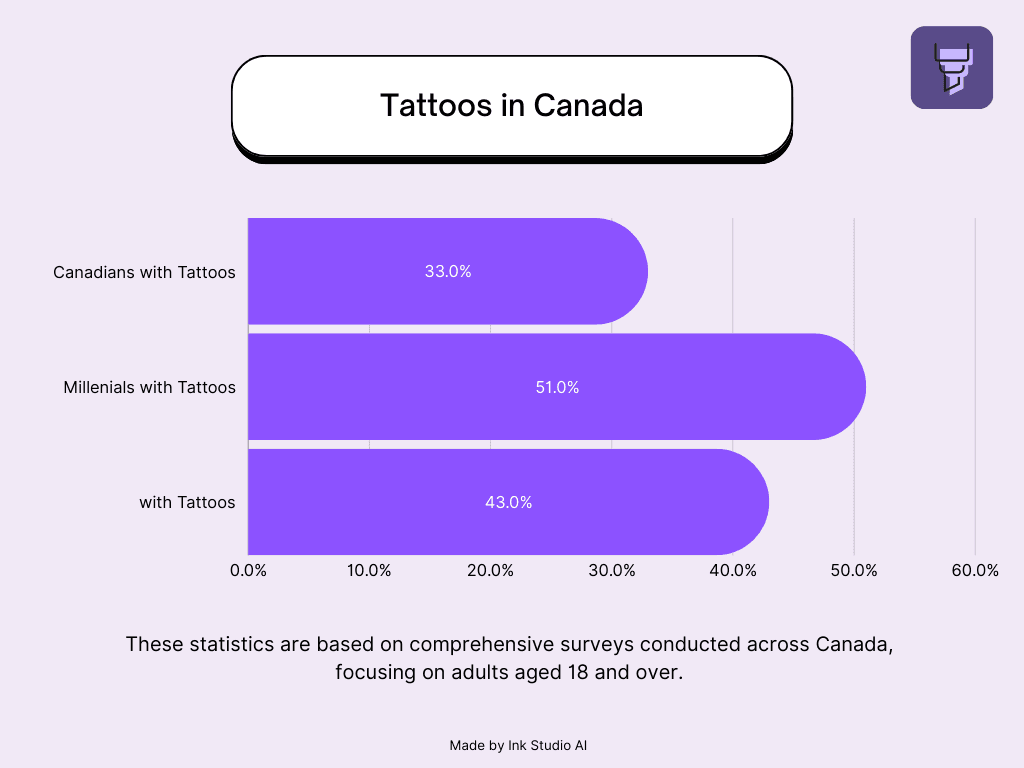
A March 2024 Narrative Research survey of 1,230 Canadians found that about one third have a tattoo. Women (38%) are more likely than men (28%) to have one. By generation, Millennials lead at 51%, followed by Gen X at 43%, Gen Z at 35%, and Boomers at 17%. Most Canadians keep their ink private: 70% say long sleeves and pants cover all of their tattoos.
American Ink: A Closer Look at U.S. Tattoo Statistics
 Tattoo Statistics in the US
Pew's 2023 survey is the best current source for the US. It used the American Trends Panel, a random sample, and ran from July 10 to 16, 2023. It found that 32% of adults have a tattoo and 22% have more than one. All numbers in this section come from that Pew report unless I name another source.
By Age Group
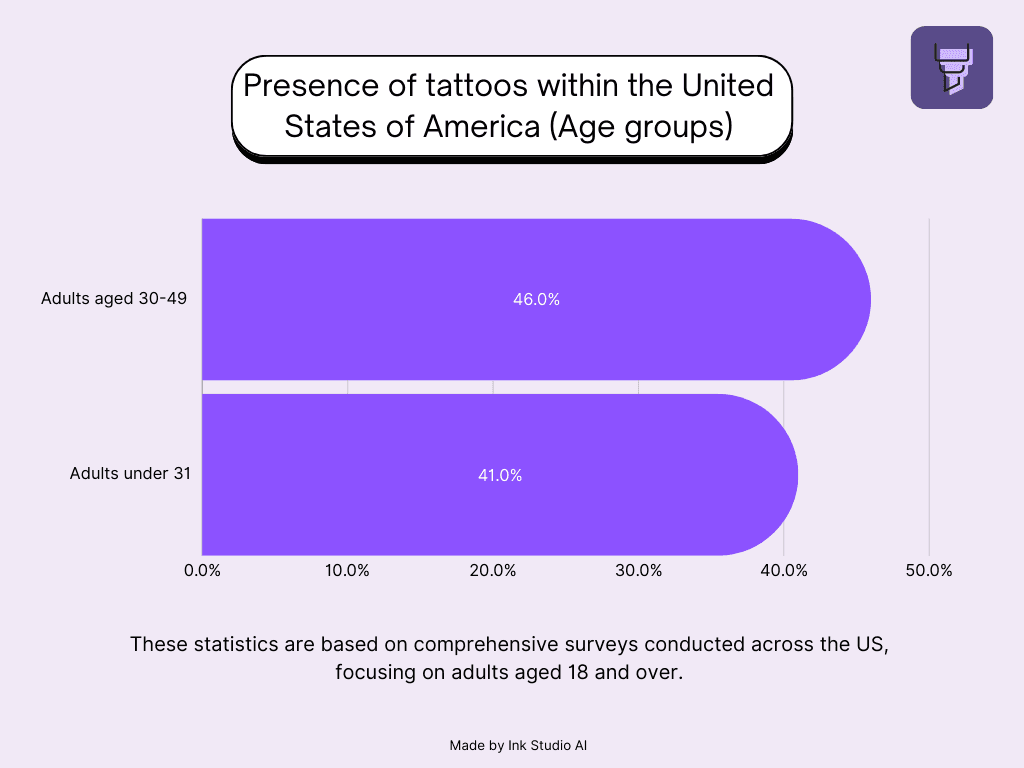 Tattoo Statistics in the US - Age Group
| Age group | Share with a tattoo (Pew, 2023) |
|---|---|
| 18-29 | 41% |
| 30-49 | 46% |
| 50-64 | 25% |
| 65+ | 13% |
Adults in their 30s and 40s are the most tattooed group, not the youngest adults. An earlier Ipsos poll from 2019 shows the same pattern: 40% of 18-34s, 36% of 35-54s, and 16% of adults 55 and older. If you are under 18 and want to join them, check how old you have to be to get a tattoo in your state first.
By Gender and Sexual Orientation
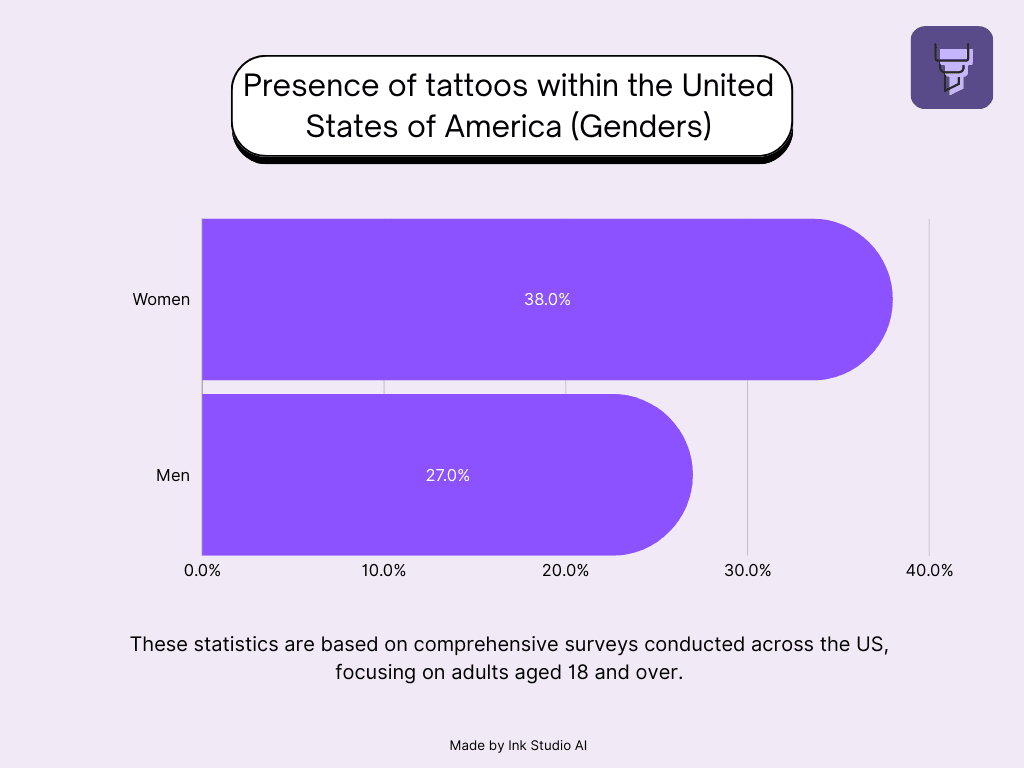 Tattoo Statistics in the US - Gender
| Group | Share with a tattoo (Pew, 2023) |
|---|---|
| Women | 38% |
| Men | 27% |
| Women aged 18-29 | 56% |
| Women aged 30-49 | 53% |
| Lesbian, gay, or bisexual adults | 51% |
| Lesbian, gay, or bisexual women | 68% |
| Straight adults | 31% |
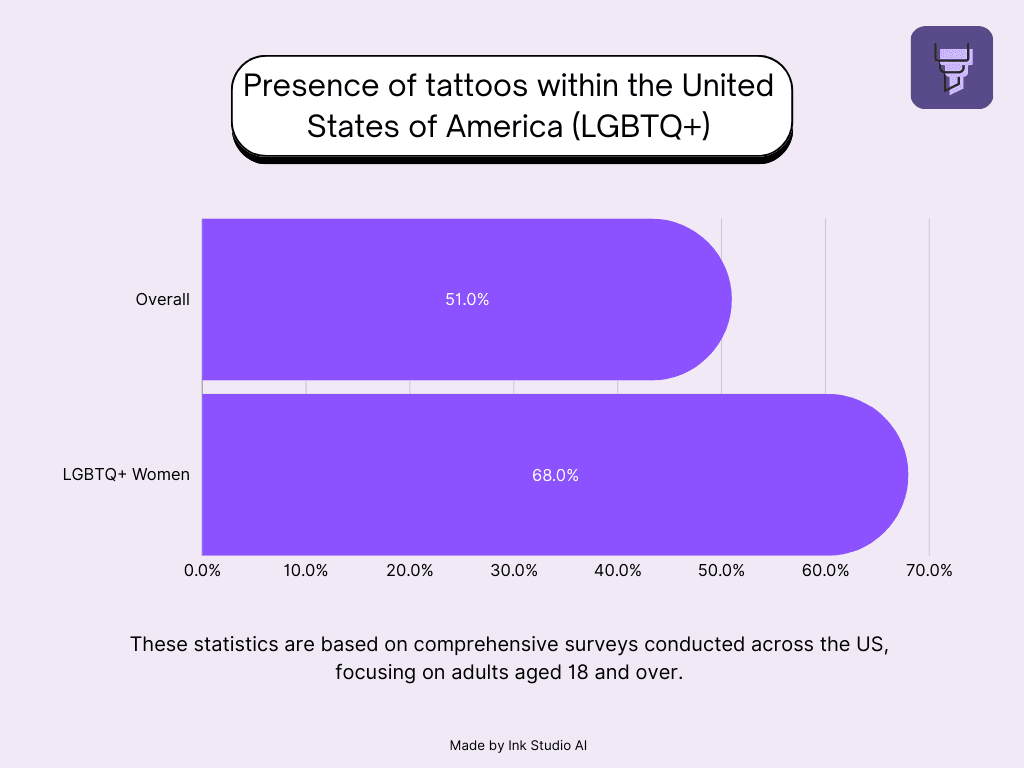 Tattoo Statistics in the US - LGBTQ+ Community
The gender gap is largest among young adults. Daniel Cox of the Survey Center on American Life (April 2026) points out that 56% of young women have a tattoo compared with 26% of young men in the Pew data. He also notes that young women drive most of the growth since 2010, while the rate for young men has dipped slightly. Among LGB women, 55% have more than one tattoo.
By Race and Ethnicity
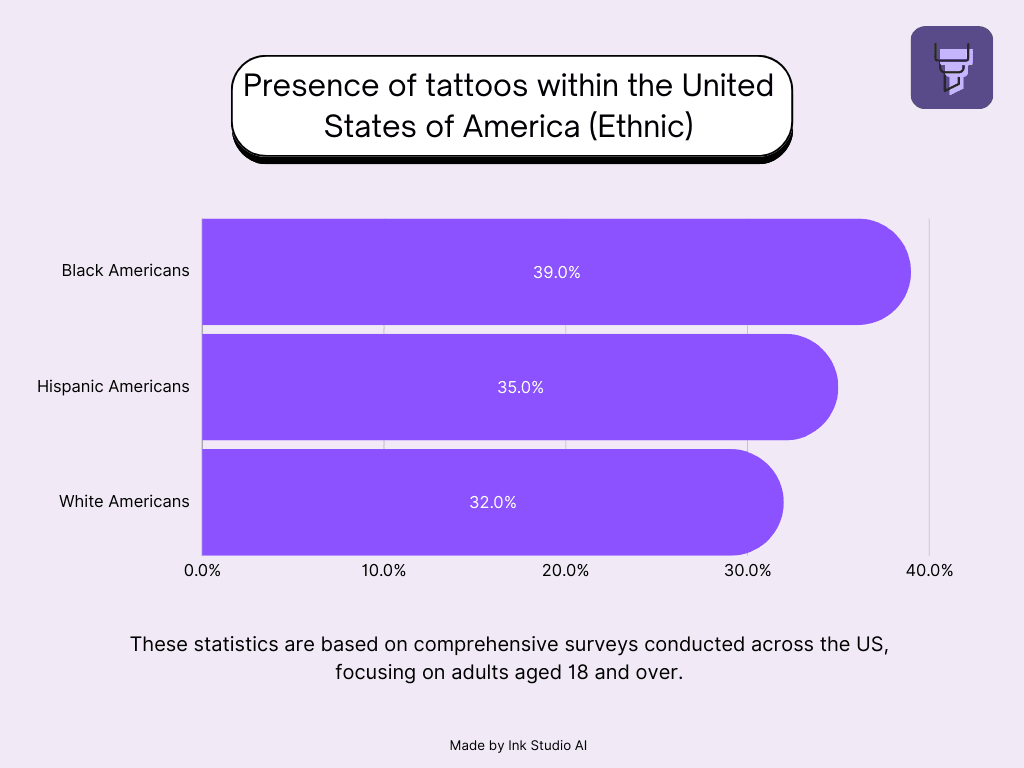 Tattoo Statistics in the US - Ethnic Demographics
| Group | Share with a tattoo (Pew, 2023) |
|---|---|
| Black adults | 39% |
| Hispanic adults | 35% |
| White adults | 32% |
| Asian adults | 14% |
By Education and Political Affiliation
| Group | Share with a tattoo (Pew, 2023) |
|---|---|
| Some college or less | 37% |
| Bachelor's degree | 24% |
| Postgraduate degree | 21% |
| Democrats and Democratic leaners | About one third |
| Republicans and Republican leaners | 32% |
Politics makes almost no difference, and neither does where people live. Urban, suburban, and rural adults each sit at about one third, and Pew found no meaningful gap between veterans and non-veterans.
Income and Religious Factors
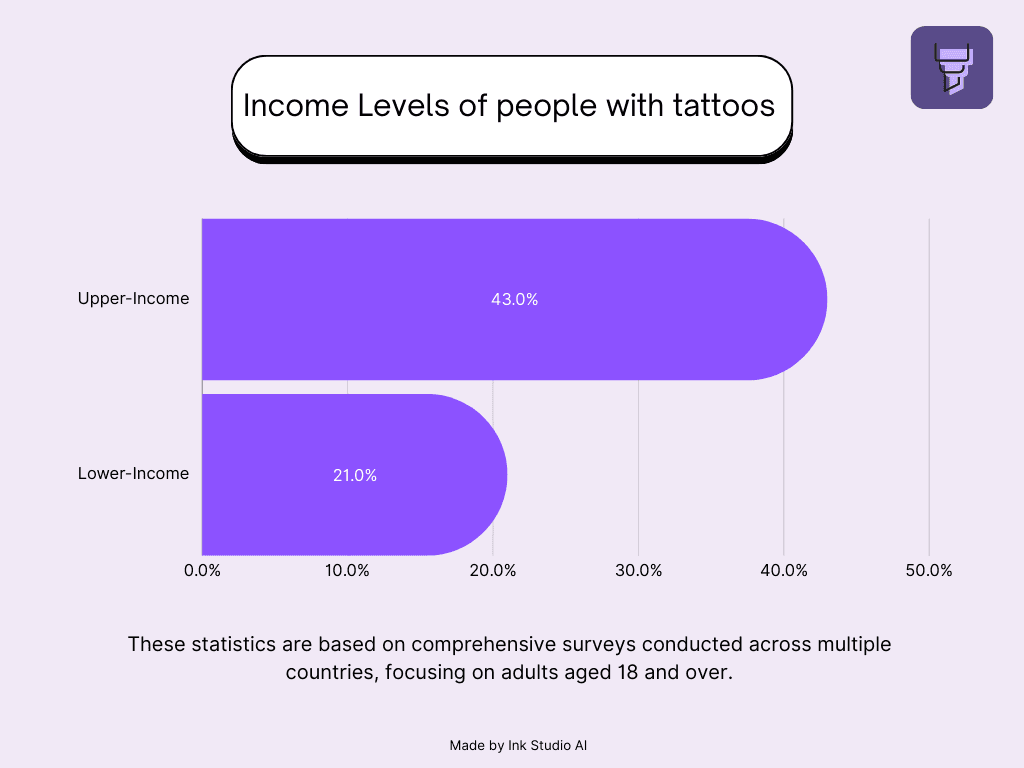
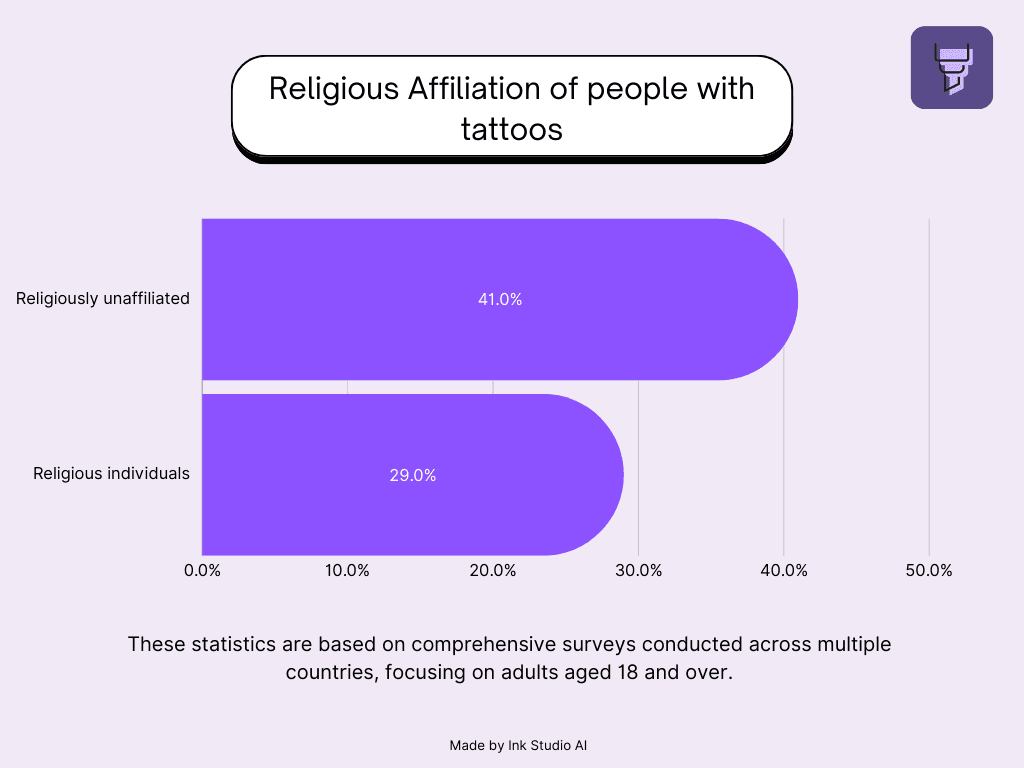
Income and religion show some of the widest gaps in the Pew data.
 Tattoo Statistics in the World - Income Levels
| Group | Share with a tattoo (Pew, 2023) |
|---|---|
| Lower-income adults | 43% |
| Middle-income adults | 31% |
| Upper-income adults | 21% |
| Religiously unaffiliated | 41% |
| Religiously affiliated | 29% |
 Tattoo Statistics in the World - Religious Affiliation
Religion can matter even more at the local level. A 2024 study by McCarty and colleagues analyzed about 18,700 Utah adults from the 2020-2021 state health survey (BRFSS). It found tattoos on 44% of women who are not members of The Church of Jesus Christ of Latter-day Saints, but on only 10% of women who are members. The figures for men were 35% and 9%. The study is a preprint and is not yet peer reviewed. If faith is part of your decision, I wrote a separate guide on what the Bible says about tattoos.
Which Generation Has the Most Tattoos?
Millennials have the most tattoos in every survey that splits by generation.
| Generation | US, Harris Poll 2015 | Canada, Narrative Research 2024 |
|---|---|---|
| Gen Z | Not measured | 35% |
| Millennials | 47% | 51% |
| Gen X | 36% | 43% |
| Baby Boomers | 13% | 17% |
| Matures | 10% | Not measured |
The 2015 Harris Poll also found that 37% of Millennials had more than one tattoo, compared with 6% of Boomers. Gen Z is still young, so its rate will likely rise as more of its members turn 18. In the Pew data, 19% of untattooed adults under 30 say they are extremely or very likely to get one in the future, compared with 2% of those aged 50-64.
Tattoo Trends Over Time (2010s to 2026)
| Year | Share of US adults with a tattoo | Source |
|---|---|---|
| 2010 | 23% (phone survey) | Pew, 2023 report |
| 2012 | 21% | Ipsos, 2019 release |
| 2015 | 29% | Harris Poll, 2015 |
| 2015 | 24% | YouGov, 2015 |
| 2019 | 30% | Ipsos, 2019 |
| 2023 | 32% | Pew, 2023 |
| 2025 | 24% | YouGov, 2025 |
The direction is clear: the share went from about one in five adults in 2012 to about one in three in 2023. Do not read the table as a smooth line, though. Pew says its 2010 phone result and its 2023 online result are not directly comparable, and the Survey Center on American Life argues the real increase may be smaller than it looks. The 2025 YouGov figure of 24% (women 30%, men 19%) comes from a smaller opt-in panel of 1,115 adults, so I treat it as a different measurement, not as a drop.
Attitudes moved faster than ownership. In YouGov's 2025 poll, 37% of Americans view tattoos favorably, up from 26% in June 2015, and 76% say a tattoo design can be art, up from 65%. In Europe, the European Chemicals Agency projects that tattoo prevalence could reach 26.1% by 2040 if growth continues at the 2003-2014 pace (ISS summary).
The Why Behind the Ink
 Tattoo Statistics in the World - Motivations for getting tattoos
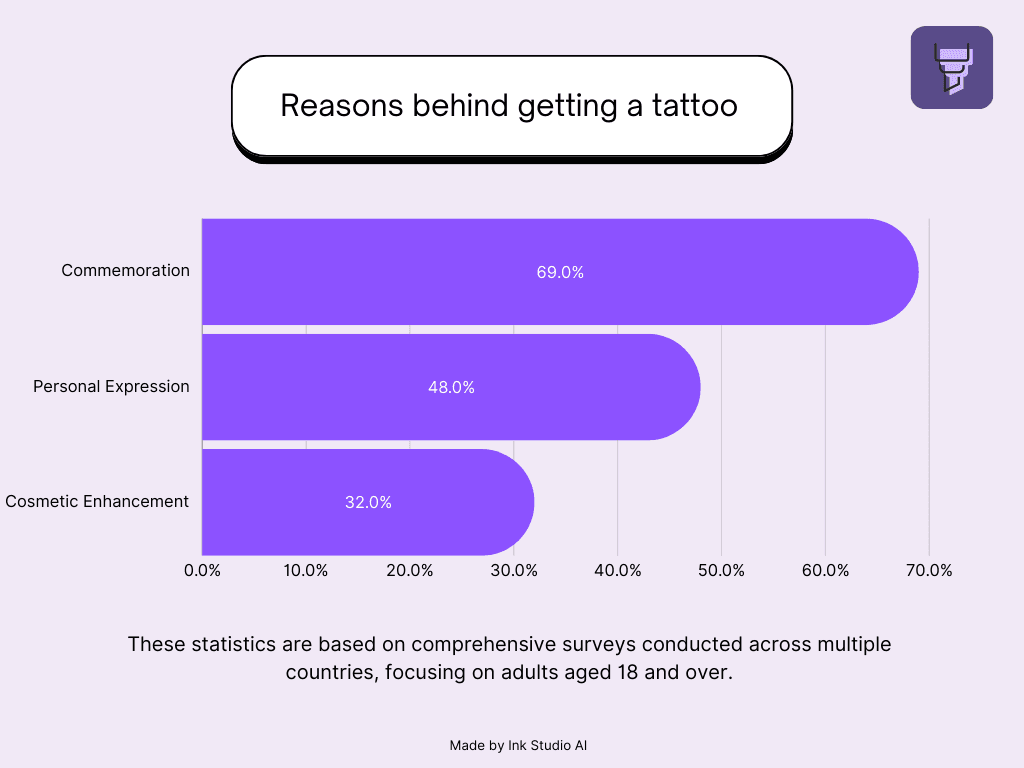
Pew asked tattooed Americans in 2023 which reasons played a part in their decision. Respondents could choose more than one.
| Reason | All tattooed adults | Notes |
|---|---|---|
| To honor or remember someone or something | 69% | Women 73%, men 63% |
| To make a statement about beliefs | 47% | Black 56%, Hispanic 46%, White 44% |
| To improve how they look | 32% | Black 42%, Hispanic and White about 30% |
YouGov's 2025 survey asked about inspiration instead. A favorite animal, flower, or symbol (7%) and liking the look (7%) came first, followed by life experiences (6%), a family member who died (5%), and a quote or phrase (5%). Tattoos also tend to lead to more tattoos: 91% of tattooed respondents would consider another one. If you are looking for a starting point, browse our tattoo ideas by theme.
How Many People Regret Their Tattoos?
Most people keep liking their tattoos, but about one in four regrets at least one.
| Measure | Figure | Source and year |
|---|---|---|
| Tattooed US adults who regret at least one tattoo | 24% | Pew, 2023 |
| Tattooed US adults who ever regretted a tattoo | 23% (14% in 2012) | Harris Poll, 2015 |
| Tattooed US adults happy with their tattoos | 92% | Ipsos, 2019 |
| Regret if first tattoo was before age 21 vs after 21 | 38% vs 7% | YouGov US, 2015 |
| Tattooed Britons with regrets | 14% | YouGov, 2015 |
| Tattooed Italians who want a tattoo removed | 17.2% | ISS, survey ended 2015 |
| Tattooed Italians who already had one removed | 4.3% | ISS, survey ended 2015 |
Regret rises when people get tattooed young. In the Pew data, Hispanic adults (30%) report more regret than White (23%) or Black (21%) adults, and adults without a bachelor's degree report more than graduates (25% vs 19%). The Harris Poll lists the most common reasons: being too young, a change in personality or lifestyle, an ex-partner's name, poor quality work, and a design that lost its meaning.
Removal is much rarer than regret. A 2025 analysis of more than 200,000 removal clients, presented at the American Society for Laser Medicine and Surgery meeting, found that almost 70% were aged 18-39. Of the 560,042 tattoos treated, 46% were in visible areas such as the forearm, hand, or face, and 75% were black ink. The authors note that many people remove a tattoo to fade it for a cover-up, not only out of regret. You can estimate the price with our tattoo removal cost calculator.
The Shifting Landscape of Tattoo Acceptance
 Tattoo Acceptance Timeline
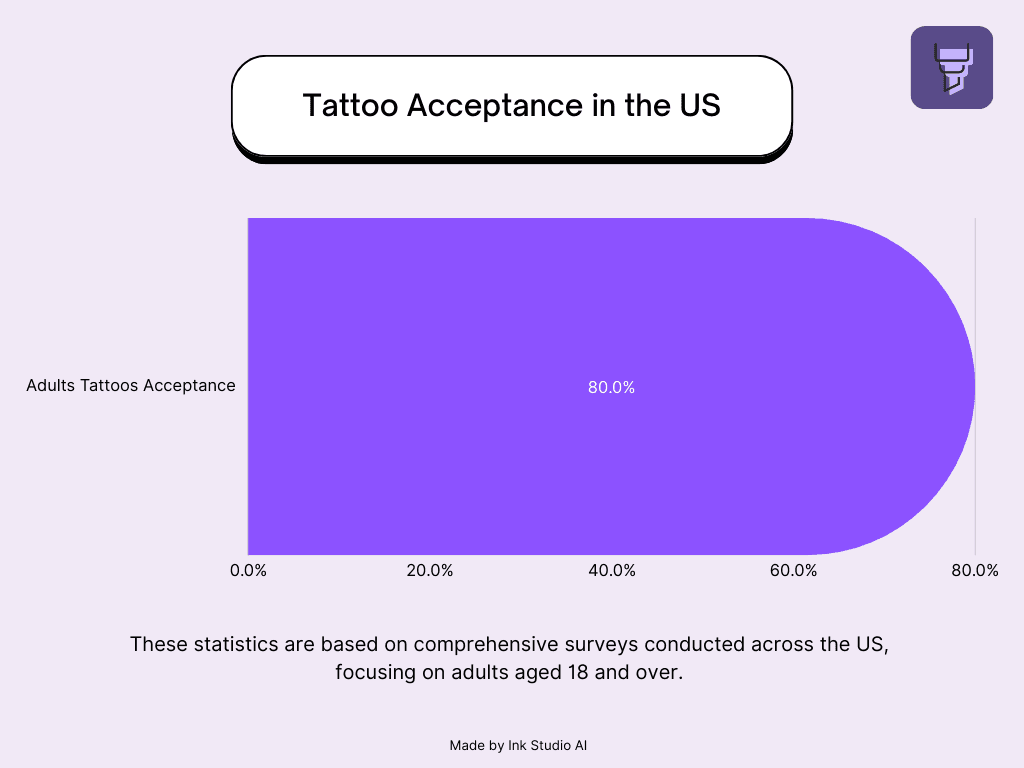
In the 2023 Pew survey, 80% of US adults said society has become more accepting of people with tattoos over the past 20 years. Only 7% said it has become less accepting. Among Americans without tattoos, 29% have a more negative impression of tattooed people, 5% have a more positive one, and 66% say it makes no difference. Adults 65 and older are the most negative, at 40%.
Work is where acceptance still has limits. In YouGov's 2025 US poll, 39% said K-12 teachers should have no visible tattoos and 34% said the same for doctors and nurses. Arms are the most accepted placement (36% say always acceptable) and the face is the least (8%). In the UK, 64% of adults would not consider visible tattoos unprofessional, but 63% would say that about face and neck tattoos (YouGov, 2022).
Why Tattoo Statistics Disagree
You will see figures for the same country that differ by 10 to 35 points. Four factors explain most of the gap:
- Who is in the sample. Opt-in online panels reach younger, more connected people. Random-sample panels like Pew's and national health surveys like Italy's ISS study cover a wider population.
- Who counts as an adult. The ISS survey included people aged 12 and older, which lowers the average. Most polls start at 18.
- How the question is asked. Phone interviews with a live interviewer can produce lower answers than self-completed online forms, which is one reason Pew does not compare 2010 and 2023 directly.
- Sample size. A survey of 1,000 people has a much wider margin of error than one of 8,000, especially for small groups like tattooed men over 65.
When you quote a number, quote the source, the year, and the method with it. For the US, Pew's 2023 figure of 32% is the most solid. For a global figure, the honest answer is a range, not one number.
What These Numbers Mean If You Are Planning a Tattoo
The regret data is the most useful part for anyone planning a first piece. Regret is lowest for people who get tattooed after 21, who choose a meaningful design, and who pick a skilled artist. Placement also matters if you work in a conservative field, because face, neck, and hand tattoos are still the least accepted.
Plan the design before you book. Bring reference images, think about size and placement, and set a budget with our guide on how much a tattoo costs. If you want to test ideas first, our AI tattoo generator makes concept images that you can discuss with your artist. They are a starting point for that conversation, not a finished stencil.
Frequently Asked Questions
What percentage of Americans have tattoos?
About 32% of US adults have at least one tattoo, and 22% have more than one, according to Pew Research Center's 2023 survey. Earlier polls found 21% in 2012 (Ipsos) and 29% in 2015 (Harris). No newer Pew figure has been published as of October 2026.
How many people in the world have tattoos?
No organization counts tattoos worldwide, so there is no reliable global total. National surveys range from about 12% in Italy's 2015 health survey to 48% in a 2018 online survey of Italian internet users. In the EU, a 2016 JRC estimate put the figure at about 12% of the population, or more than 60 million people.
Which country has the most tattoos?
In the 2018 Dalia Research online survey, Italy ranked first at 48%, followed by Sweden (47%) and the United States (46%). This survey only covered internet users in the countries it sampled, so it does not prove that Italy has the most tattoos overall. Italy's own national health survey found a much lower rate of 12.8%.
Which generation has the most tattoos?
Millennials. The 2015 Harris Poll found tattoos on 47% of US Millennials and 36% of Gen X, and a 2024 Canadian survey found 51% of Millennials and 43% of Gen X. In Pew's 2023 age data, adults aged 30-49 lead at 46%.
How many people regret their tattoos?
About one in four. Pew found in 2023 that 24% of tattooed Americans regret at least one tattoo, close to the 23% that Harris found in 2015. Age is the strongest factor: in a 2015 YouGov survey, 38% of people tattooed before 21 had regrets, compared with 7% of those tattooed after 21.
Are women or men more likely to have tattoos?
Women. In the US, 38% of women and 27% of men have a tattoo (Pew, 2023). Among adults under 30, the gap is much wider: 56% of young women compared with 26% of young men.
Do people with tattoos usually get more than one?
Yes. Among tattooed Americans, 69% have two or more (Harris Poll, 2015), and Ipsos found in 2019 that the average tattooed American has four. In YouGov's 2025 poll, 91% of tattooed adults said they would consider getting another.
Sources
- Pew Research Center: 32% of Americans have a tattoo, including 22% who have more than one (2023)
- Survey Center on American Life: Why are so many Gen Z women getting tattoos? (2026)
- YouGov: Americans have become more favorable toward tattoos in the past decade (2025)
- Ipsos: More Americans have tattoos today than seven years ago (2019)
- The Harris Poll via American Med Spa Association: Tattoo takeover (2015 survey)
- YouGov: People do not regret getting tattoos in later life (2015)
- McCarty et al.: Tattooing in a population-based study of about 18,000 US adults (2024 preprint)
- Statista: Where tattoos are most popular (Dalia Research, 2018)
- Narrative Research: One third of Canadians have tattoos (2024)
- YouGov UK: Should visible tattoos be allowed in the workplace? (2022)
- Istituto Superiore di Sanità: Tattoos in Italy and in Europe
- Practical Dermatology: Tattoo removal trends in a global analysis of over 200,000 individuals (2025)